
Observability
Observability is the capability to infer the internal states of a system from its external outputs. It extends beyond simple monitoring to provide deep insights into system behavior, enabling proactive issue detection and resolution. This guide explores observability in depth, covering its core concepts, practical examples, and popular tools used in each scenario.
Core Concepts of Observability
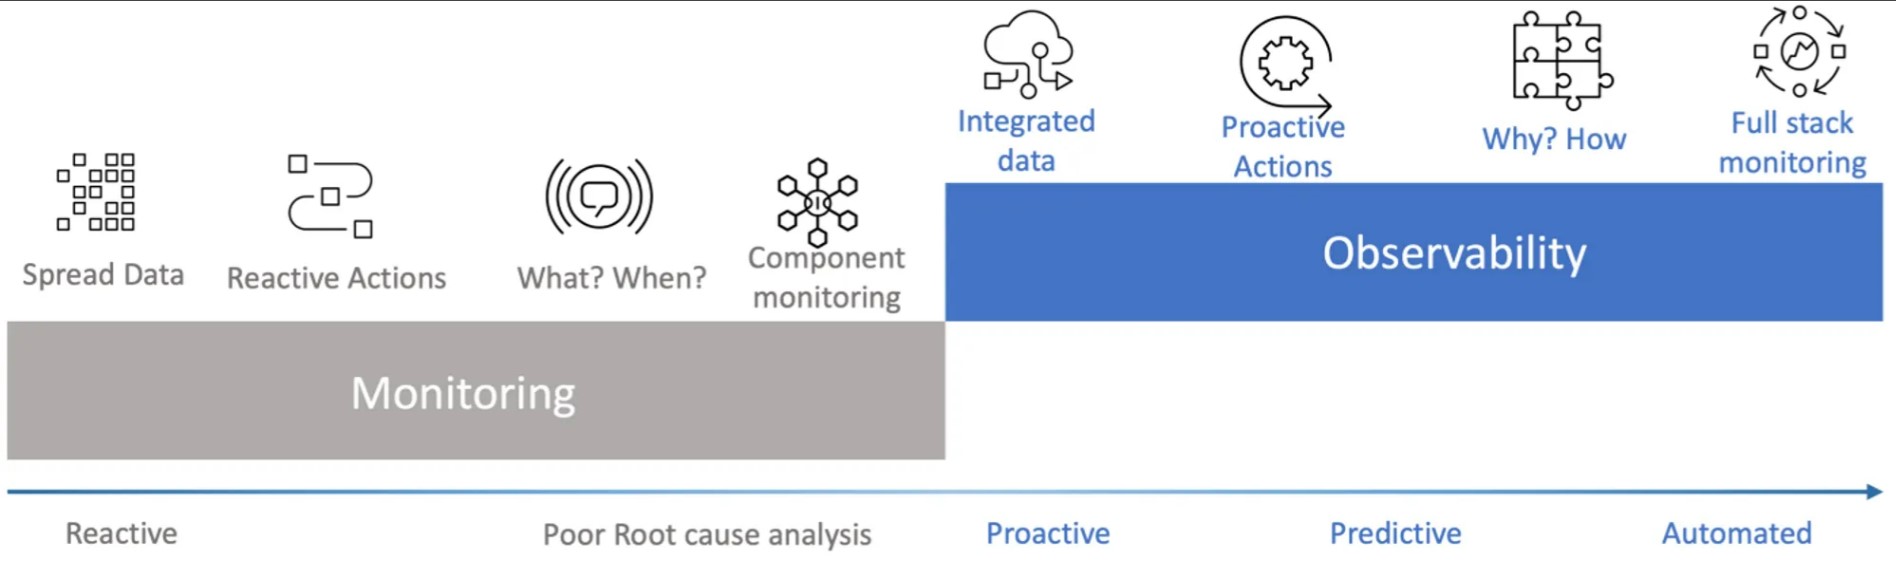
Monitoring vs. Observability
-
Monitoring: Reactive, focused on detecting what happened. Typically involves collecting and displaying metrics on dashboards, setting up alerts for specific conditions, and generating reports.
- Example: Monitoring CPU usage and setting an alert if it exceeds 80%.
- Tools: Prometheus, Grafana, Nagios.
-
Observability: Proactive, focused on understanding why something happened. It involves gathering comprehensive data from logs, metrics, and traces to analyze and understand system behavior.
- Example: Using traces to determine why a specific microservice is slow.
- Tools: New Relic, DataDog, Splunk.
Telemetry Data
Telemetry data is the information collected from various components of a system to provide visibility into its operations. The main types of telemetry data are logs, metrics, events, and traces, often abbreviated as MELT.
Logs
Logs are detailed, timestamped records of events that occur within a system. They are crucial for debugging and understanding the sequence of operations.
- Example: Application logs showing user authentication attempts, errors, and transactions.
- Tools: ELK Stack (Elasticsearch, Logstash, Kibana), Splunk, Fluentd.
Metrics
Metrics are numerical values representing the performance and behavior of a system over time. They are typically aggregated and can be used to monitor trends and set up alerts.
- Example: CPU usage, memory consumption, number of HTTP requests per second.
- Tools: Prometheus, Graphite, InfluxDB.
Events
Events are discrete actions that occur at a specific moment in time. They can be simple, like a user login, or complex, like a multi-step transaction.
- Example: User login events, file upload completions, system crashes.
- Tools: Amazon CloudWatch Events, Azure Event Grid, Google Cloud Events.
Traces
Traces represent the flow of a request through various components of a system, allowing you to visualize and understand the entire journey and identify bottlenecks.
- Example: A trace showing the path of a user request through multiple microservices, including database queries and external API calls.
- Tools: Jaeger, Zipkin, OpenTelemetry.
Key Components of Observability
Alerting
Alerting is the process of automatically notifying relevant personnel when certain conditions are met in the monitored data. It ensures that issues are promptly addressed.
- Example: Sending an alert when response times exceed a predefined threshold.
- Tools: PagerDuty, Opsgenie, VictorOps.
Correlation
Correlation involves analyzing how different metrics, logs, and traces relate to each other to identify patterns and understand the root causes of issues.
- Example: Correlating an increase in database latency with a spike in user traffic.
- Tools: Splunk, Elastic Observability, DataDog.
Root Cause Analysis (RCA)
Root Cause Analysis is the process of identifying the underlying causes of observed issues. It often involves deep analysis of logs, metrics, and traces to pinpoint the exact problem.
- Example: Using tracing data to identify a specific microservice that is causing overall system delays.
- Tools: New Relic, DataDog, Splunk.
Dashboards
Dashboards are visual representations of metrics and logs, providing an at-a-glance view of system health and performance. They are essential for real-time monitoring and analysis.
- Example: A Grafana dashboard displaying CPU, memory, and disk usage across all servers.
- Tools: Grafana, Kibana, Tableau.
Synthetic Monitoring
Synthetic monitoring involves simulating user interactions with an application to test performance and availability. It helps ensure that systems meet expected SLAs and performance criteria.
- Example: Using automated scripts to simulate user logins and transactions to monitor response times.
- Tools: New Relic Synthetics, Pingdom, Catchpoint.
Real User Monitoring (RUM)
Real User Monitoring tracks the behavior of actual users as they interact with an application, providing insights into user experience and performance from the user’s perspective.
- Example: Measuring the load time of web pages for users from different geographical locations.
- Tools: New Relic RUM, DataDog RUM, Google Analytics.
Practical Examples
Example 1: Using Logs for Debugging
A developer is facing an issue where users are unable to log in. By analyzing the authentication service logs, they discover error messages indicating a misconfigured database connection. Fixing the configuration resolves the login issue.
- Tools: ELK Stack, Splunk.
Example 2: Using Metrics for Capacity Planning
An SRE team uses CPU and memory usage metrics to plan for future capacity. The metrics show that servers frequently run at 80% capacity. The team decides to add more servers and optimize the application to handle the increased load.
- Tools: Prometheus, Grafana, DataDog.
Example 3: Using Traces for Performance Optimization
A trace reveals that a specific microservice call is taking significantly longer than others. By optimizing this service, the overall application performance improves, reducing latency and enhancing user experience.
- Tools: Jaeger, Zipkin, New Relic.
Example 4: Synthetic Monitoring for SLA Compliance
A company uses synthetic monitoring to ensure their application meets the agreed-upon SLA. Automated scripts simulate user logins and transactions, continuously testing response times and availability, even during off-peak hours.
- Tools: New Relic Synthetics, Pingdom, Catchpoint.
Example 5: Real User Monitoring for UX Improvements
RUM data shows that users from a particular region experience slow page load times. The company deploys additional CDN nodes closer to that region, significantly improving performance and user satisfaction.
- Tools: New Relic RUM, DataDog RUM, Google Analytics.
Popular Tools for Observability
Logging Tools
- ELK Stack (Elasticsearch, Logstash, Kibana): Comprehensive logging and analysis platform.
- Splunk: Powerful platform for searching, monitoring, and analyzing machine-generated big data.
- Fluentd: Open-source data collector for unified logging.
Metrics Tools
- Prometheus: Open-source system monitoring and alerting toolkit.
- Graphite: Scalable real-time graphing system.
- InfluxDB: Time-series database for high-performance data ingestion and querying.
Tracing Tools
- Jaeger: Open-source end-to-end distributed tracing.
- Zipkin: Distributed tracing system for microservices.
- OpenTelemetry: Provides instrumentation for collecting telemetry data.
Synthetic Monitoring Tools
- New Relic Synthetics: Monitors applications using synthetic tests.
- Pingdom: Website monitoring service.
- Catchpoint: Digital experience monitoring platform.
Real User Monitoring (RUM) Tools
- New Relic RUM: Real user monitoring for performance insights.
- DataDog RUM: Tracks real user interactions and performance.
- Google Analytics: Tracks and reports website traffic.
Conclusion
Observability is a critical aspect of modern IT operations, providing the insights needed to understand, diagnose, and optimize complex systems. By leveraging logs, metrics, events, and traces, along with advanced tools and techniques, organizations can move beyond reactive monitoring to proactive, insightful management of their systems. This guide provides a comprehensive overview of the core concepts, practical examples, and popular tools essential for achieving effective observability.